Data Analytics & Business Intelligence
Analytics dashboards, reporting automation, KPI tracking and decision-support tools built directly on live operational data.
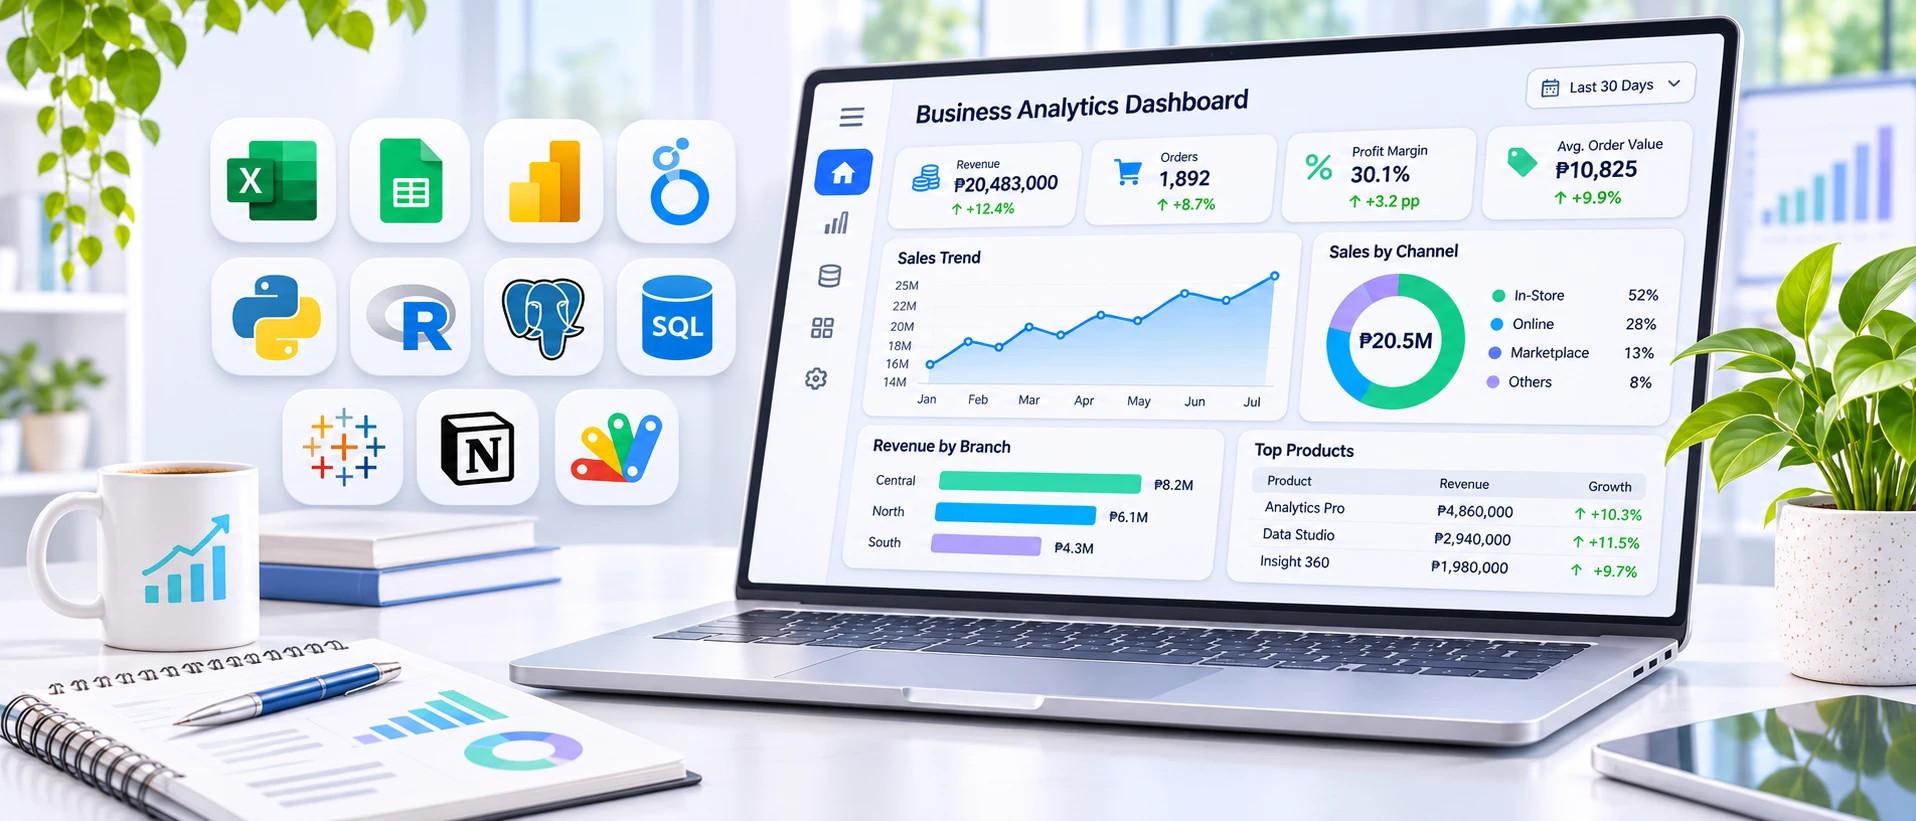
I don't just make charts. I understand how the business runs, organize the data behind it, automate the reporting and build the systems that help teams decide faster.
Finance and operations first
Retail sales, payments and multi-branch performance are the work I started in. The tools came later.
Messy data, organized
Exports from different systems cleaned, matched and merged into one dataset people can trust.
Systems, not one-off charts
Reports that rebuild themselves from live data instead of a spreadsheet someone updates by hand.
Everything below is interactive and runs on fictional sample data.
What I can build
- 01
KPI dashboards
One screen for revenue, margin, orders and fulfillment, by branch.
- 02
Data pipelines (ETL)
Exports from many systems cleaned and merged into one source of truth.
- 03
Financial analysis
Budget vs actual, margins and supplier cost variance that point to action.
- 04
Reporting automation
Sheets and Apps Script workflows that build the weekly report for you.
- 05
Sales & customers
Funnel conversion, attribution and segments that show where sales come from.
- 06
Operations tracking
Orders, payments and bottlenecks visible before customers chase them.
01Business performance
KPI dashboards people actually open.
- The problem
- Numbers live in different spreadsheets, so nobody sees the whole business until month-end.
- What I build
- One live dashboard for revenue, margin, orders and fulfillment, filterable by branch and period.
- What you gain
- Managers spot a slipping branch or margin this week, not after the quarter closes.
Retail performance · FY 2026
Sample dataTotal revenue
All sales for the year, before costs. Compared with the same period last year.₱89.0M
Gross profit
Revenue minus the cost of the goods sold. What's left to pay for rent, salaries and other running costs.₱36.1M
Profit margin
Gross profit as a share of revenue. A change here means pricing or costs moved, not just volume.40.6%
Avg. order value
Revenue divided by the number of orders. Shows whether customers are spending more per visit.₱15,650
On-time fulfillment
Orders released on or before the promised date, out of all completed orders.91.4%
Monthly revenue and gross profit
| Period | Revenue | Gross profit |
|---|---|---|
| Jan | ₱6,073,000 | ₱2,482,000 |
| Feb | ₱5,809,000 | ₱2,381,000 |
| Mar | ₱6,455,000 | ₱2,652,000 |
| Apr | ₱6,878,000 | ₱2,771,000 |
| May | ₱7,543,000 | ₱3,079,000 |
| Jun | ₱7,152,000 | ₱2,875,000 |
| Jul | ₱6,722,000 | ₱2,729,000 |
| Aug | ₱7,387,000 | ₱3,009,000 |
| Sep | ₱7,572,000 | ₱3,067,000 |
| Oct | ₱7,712,000 | ₱3,152,000 |
| Nov | ₱8,926,000 | ₱3,633,000 |
| Dec | ₱10,728,000 | ₱4,294,000 |
Sales by channel
All branches, share of revenue
Revenue
₱89.0M
Sales by branch
Select a branch to filter the dashboard
Order fulfillment
An order counts as on time when it is released to the customer on or before the date we promised.5,684 orders this year
On-time rate by month
02Data transformation
From five messy exports to one table you can trust.
- The problem
- Orders, payments and customers sit in different files and formats, full of duplicates and gaps.
- What I build
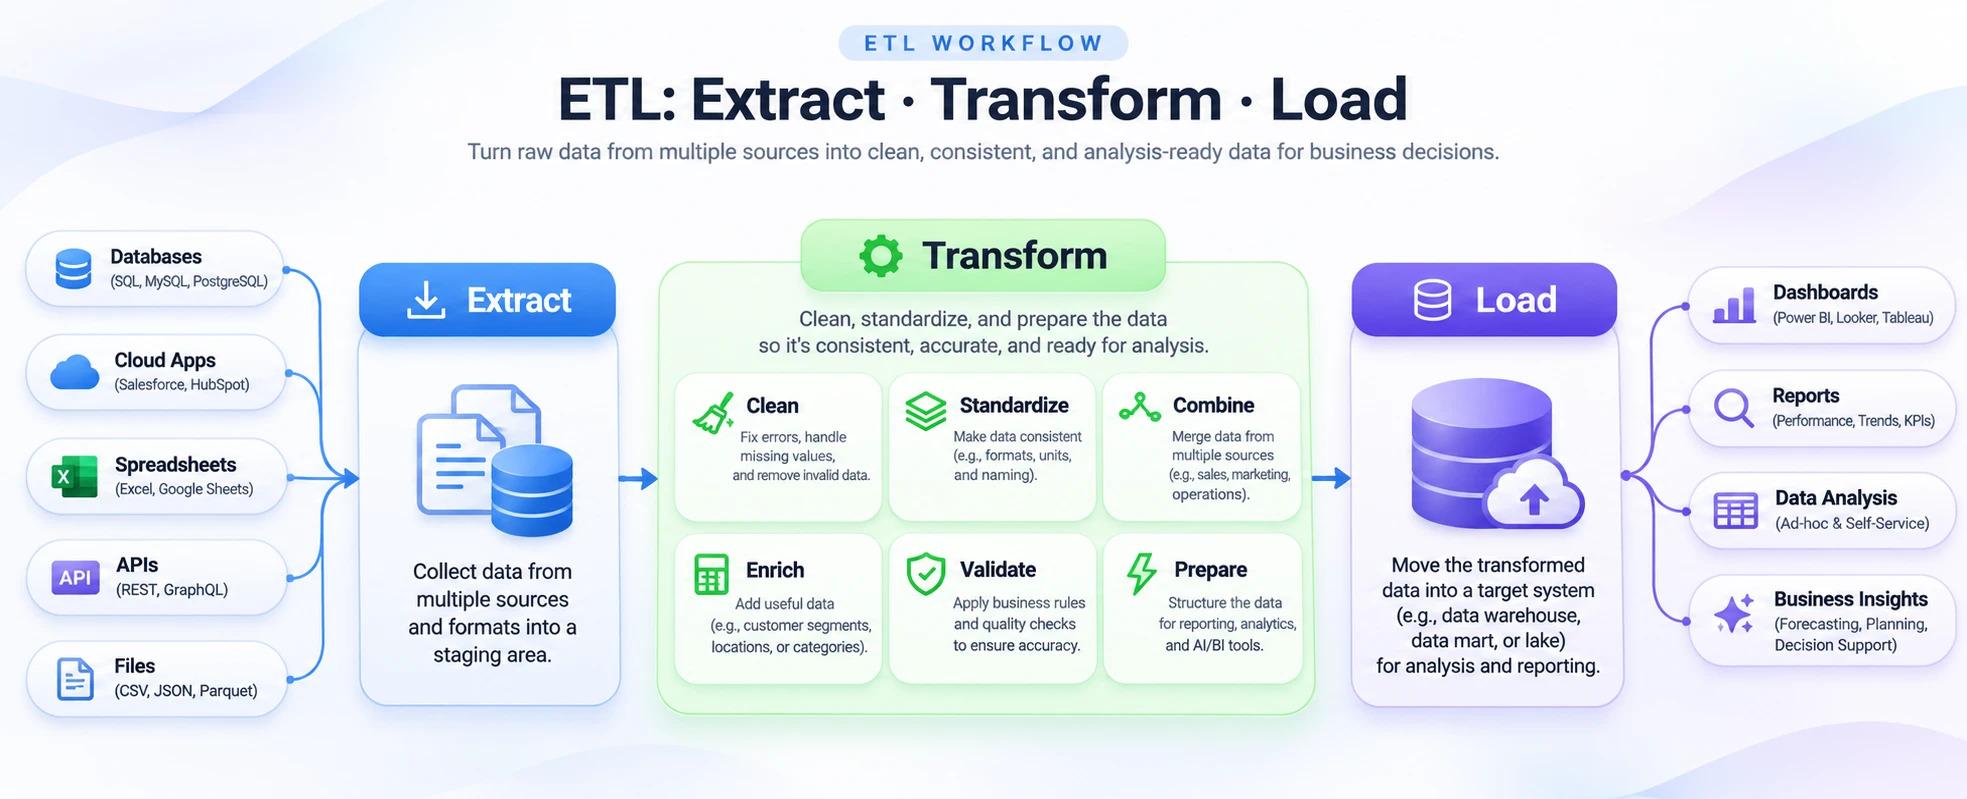
- ETL pipelines that pull every source, clean and standardize it, check it against your rules and load it for reporting.
- What you gain
- Reports built on one consistent dataset, so the numbers match no matter who runs them.
Extract → Transform → Load
Sample data- Excel exportorders.xlsx128
- Google SheetsPayments log96
- CSV filecustomers.csv240
- DatabasePOS sales164
- Order recordsManual forms14
report_orders
waiting for data
Orders dashboard
- Order value
- —
- Paid
- —
- To review
- —
extract
Extract
Pull records from every source into one staging area, exactly as they are.
03Financial analysis
Profitability you can act on, branch by branch.
- The problem
- Revenue looks healthy, but nobody can say which branch, cost line or supplier is eating the margin.
- What I build
- Financial views that put revenue, costs, budget and supplier invoices side by side, with variances called out.
- What you gain
- Clear next steps: which costs to cut, which quotes to re-bid, which branch needs attention.
Profit & loss · All branches
Sample dataRevenue
Total sales in the period, compared with what was budgeted.₱21.7M
Gross profit
Revenue minus cost of goods sold. Gross margin is gross profit as a share of revenue.₱8.80M
Operating expenses
Rent, salaries, utilities and other running costs. Green means spending came in under budget.₱4.98M
Operating income
Gross profit minus operating expenses: what the branch actually earns before tax.₱3.83M
Revenue vs operating expenses
Month-over-month revenue
How much revenue changed compared with the month before. December holiday sales make January look like a drop.Budget vs actual
The bar is the actual figure; the dark tick is the budget. For costs, finishing under budget is good.- Revenue1.1% downActual ₱21.7MBudget ₱21.9M
- Gross profit2.1% downActual ₱8.80MBudget ₱8.99M
- Operating expenses0.7% downActual ₱4.98MBudget ₱5.01M
Branch profitability
Operating income as a share of revenue. It shows how much of every peso a branch keeps after all running costs.Operating margin, Q3
Quoted vs actual supplier cost
Each supplier quote is matched with the invoice that followed. Overruns show where pricing or terms slipped.QuotedActual, over quoteActual, under quote
Margin gap between branches
South runs at 9.6% operating margin against 22.1% at Central. Its running costs take 27.5% of revenue: start with staffing hours and rent.
Supplier costs over quote
Courier & insurance came in +17.9% over the quote. Across all lines invoices were ₱24K above quotes: worth a re-bid.
Behind budget
Revenue is 1.1% below budget for Q3. The weakest month was Jul (−6.0% month on month).
04Reporting automation
The weekly report that builds itself.
- The problem
- Someone spends hours every week copying branch sheets together, fixing typos and rebuilding the same summary.
- What I build
- Google Sheets and Apps Script workflows that import, validate, de-duplicate, merge and summarize on one click or on a schedule.
- What you gain
- The same report every time, in minutes, with bad entries flagged instead of silently included.
- Sheets / Excel
- Data validation
- Apps Script
- Consolidated report
- Export / dashboard
Raw_Import is emptyPress “Run demo automation” to pull in three branch sheets.
- Waiting for a run…
05Sales & customers
Where sales come from, and where they leak.
- The problem
- Leads come in from ads, walk-ins and referrals, but nobody can say which ones turn into sales.
- What I build
- Funnel, attribution and customer-segment reporting on top of the order data the team already enters.
- What you gain
- Marketing spend goes to channels that convert, and follow-ups focus on the stage where deals stall.
Sales pipeline
Sample dataHover or tap a stage to explore it
Stage 4 of 4
Won
- Count
- 97
- Step conversionShare of the previous stage that reached this one.
- 45.8%
- From leadShare of all leads that reached this stage, compared with the other quarter.
- 7.8%0.7 pp up
- Avg. days in stage
- 2.0
- Revenue won
- ₱2,134,000
Sales attribution
Which source each won sale came from. Untagged sales are a data-quality task: the lower, the better.- Ad-influenced38%
- Organic31%
- Referral19%
- Untagged12%
Sales vs target
Each branch's sales as a share of its quarterly target. The dark line marks 100%.- Central104%
- North92%
- South81%
Customer segments
Customers grouped by how and how much they buy. Width is the share of customers; the figure is their average order value.- New46%
- Returning31%
- VIP8%
- At risk15%
Order value & repeat buying
Share of this quarter's customers who had bought before.Avg. order value
₱16,300
Repeat rate
27.4%
Weekly average over the last 6 weeks
06Operations tracking
Every order, payment and delay in one view.
- The problem
- Order status lives in chat threads and notebooks, so delays and unpaid balances surface only when a customer calls.
- What I build
- Order tracking that follows each job from deposit to release, with payment status, balances and stage timing.
- What you gain
- Bottlenecks and overdue balances show up early, and any staff member can answer “where is my order?”
Order tracker · today
Sample dataWatching for updates…
Swipe the board sideways to see every stage.
ORD-5016
P. Uy
Custom order · 3 items · North
- 1
- 2
- 3
- 4
- 5
Quality check · waiting 2.5 days
- Order total
- ₱31,000
- Paid
- ₱15,500
- Balance
- ₱15,500
- PendingMar 2
- In productionMar 3
- Quality checkMar 4
Outstanding balances
Order value not yet paid, across all open and released orders.₱102,650
- 4 paid
- 4 partial
- 1 unpaid
Bottleneck
2 orders have waited 2+ days in Quality check, 2 more elsewhere.
Unpaid orders stay in Pending until a deposit arrives.
Branch comparison
- Central3 open
₱56,250 due
- North2 open
₱15,500 due
- South3 open
₱30,900 due
Featured work
Where this comes from.
Real projects and concepts drawn from finance, retail and operations work. Each is labelled for what it is, and client names are withheld.
Real work · details generalized
Spreadsheet reporting automation
Challenge: Branch sales and payment records sat in separate sheets that had to be combined, filtered and summarized by hand for every report.
- My approach
- Google Sheets workflows driven by Apps Script that consolidate branch data, filter the records a report needs, build payment summaries and export the finished report.
- Technologies
- Google SheetsGoogle Apps ScriptExcel
- Business value
- Reports built the same way every time, without copying rows between sheets.
Concept · based on real retail operations
Multi-branch retail reporting
Challenge: Comparing sales, payments and revenue across branches meant pulling separate reports and lining them up by hand.
- My approach
- One set of definitions for revenue, payments and outstanding balances across every branch, so they can be compared side by side and tracked over time.
- Technologies
- Google SheetsExcelPostgreSQLCustom dashboards
- Business value
- A single comparable view of branch performance instead of reports that don't quite match.
In production · client anonymized
Retail Service Operations Portal
Challenge: The business ran on separate Excel calculators, a Google Form and manual tracking. Orders, layaways, repairs and stock lived in different places.
- My approach
- A single system of record for customers, orders, payments, layaways, repairs and inventory, with reporting on the same live data: ad attribution, margin tracking and an operational dashboard.
- Technologies
- Next.jsTypeScriptPostgreSQLPrisma
- Business value
- Staff work in one system, and management reports read the data staff already enter instead of a separate spreadsheet.
Real work
Quotation & profitability analysis
Challenge: Quotes were priced by hand in multi-step spreadsheets, and nobody could see what an order really earned once supplier invoices arrived.
- My approach
- Quote pricing with markup rules, a cost snapshot frozen when a quote becomes an order, supplier invoices reconciled against it, and profit and margin tracked per order. Supplier Excel exports in different layouts are normalized before pricing.
- Technologies
- PostgreSQLSQLExcel importsNext.js
- Business value
- Margin is visible per order, and cost overruns show up against the original quote.
Tools & technologies
The everyday toolkit.
Tools I use in real work, and what for. Each card shows a typical line of the work.
Microsoft Excel
Cleaning exports, lookups, pivot summaries and pricing calculators.
=SUMIFS(Sales[Amount], Sales[Branch], "North")Google Sheets
Shared trackers, payment logs and team reports everyone can edit.
=QUERY(Orders!A:F, "select B, sum(E) group by B")Google Apps Script
Automating imports, validation, consolidation and exports.
ScriptApp.newTrigger('buildWeeklyReport').timeBased().everyWeeks(1)PostgreSQL
Reporting queries and SQL functions behind live dashboards.
SELECT branch, SUM(total) FROM orders GROUP BY branch;Custom dashboards
Role-based reporting screens built into business web apps.
<KpiCard metric="revenue" groupBy="branch" />
Also in the stack: SQL functions, SheetJS for Excel imports, Prisma and Next.js for the dashboards themselves.
Spending too long putting reports together?
Tell me how your data flows today. I'll suggest what to automate first and what a dashboard should show.
Next expertise
Customer Experience